Xander Schmid · 23 September 2026
Fluorescence Analysis Techniques Uncover Hidden Authenticity Markers in Opaline Specimens
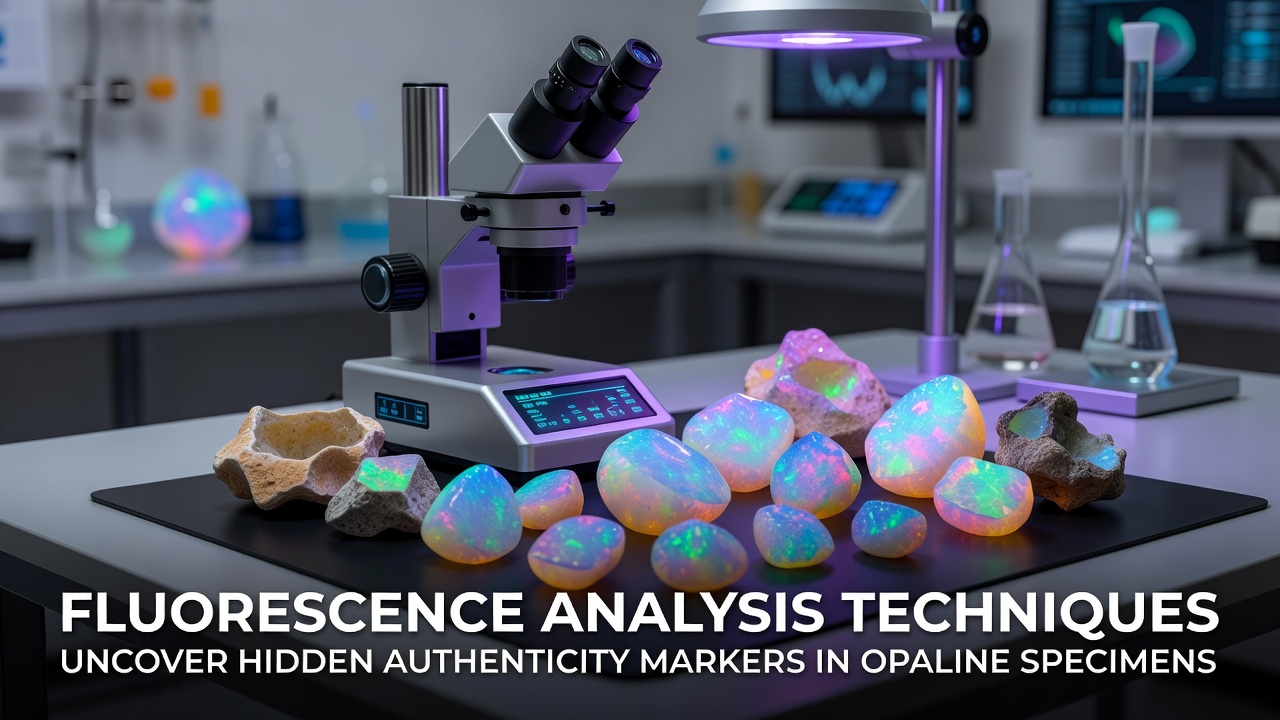
Researchers in gemology labs have turned to fluorescence analysis as a precise method for identifying authenticity markers within opaline specimens, and the approach continues to evolve with advances in spectral imaging. Data from multiple studies show that natural opals exhibit distinct fluorescence patterns under specific ultraviolet wavelengths, whereas synthetic or treated stones often lack these signatures or display uniform responses that deviate from established baselines.
Techniques typically involve exposing specimens to long-wave and short-wave UV light sources, then capturing emission spectra through calibrated detectors. Experts note that variations in intensity and color distribution can point to trace element compositions unique to certain mining regions, including those in Australia and Ethiopia. In September 2026 a collaborative project between Australian and European labs released updated reference databases that map these fluorescence profiles across hundreds of verified samples.
Core Principles of Fluorescence in Opals
Opals consist primarily of silica spheres arranged in ordered layers, and this structure interacts with ultraviolet radiation to produce visible glows in greens, blues, or oranges depending on impurities. According to research from the Gemological Institute of America, iron and uranium inclusions frequently generate the most diagnostic emission bands. Observers report that these bands remain stable over time in natural stones, providing a reliable benchmark when compared against laboratory-grown materials.
Modern equipment combines fluorescence with hyperspectral cameras that record data across narrow wavelength intervals, and this setup allows analysts to isolate markers hidden beneath the surface play-of-color. Figures from a 2025 industry report indicate that over 60 percent of questioned opals submitted for certification now undergo fluorescence screening as a first-line test before more invasive methods are applied.
Equipment and Procedural Standards
Laboratories standardize protocols around 365-nanometer and 254-nanometer excitation sources, then measure emission between 400 and 700 nanometers. Canadian mineralogical surveys have documented how portable spectrometers deployed in field stations achieve comparable results to benchtop systems when calibrated against reference opals. The process records peak wavelengths, decay times after excitation ceases, and spatial distribution maps that reveal zoning patterns typical of sedimentary deposits.
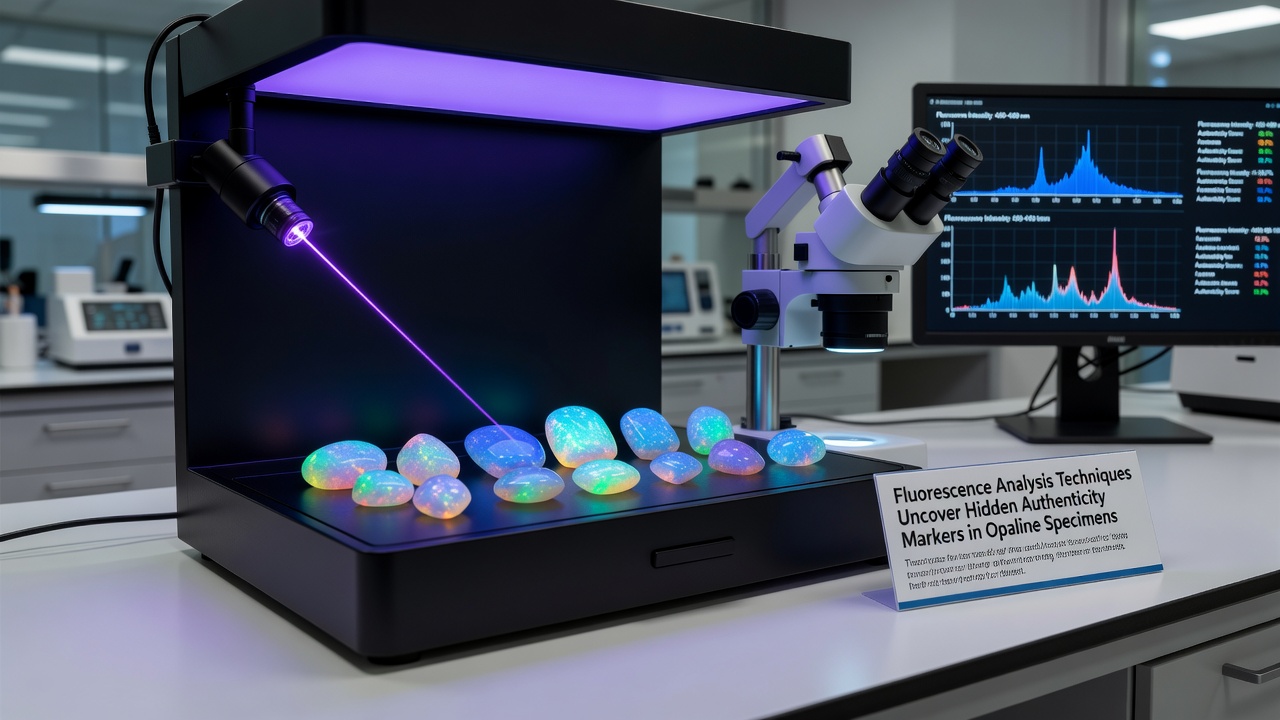
Training programs emphasize consistent sample orientation because surface texture and thickness alter apparent intensity, and technicians cross-reference results with infrared spectroscopy to confirm silica hydration levels. Data compiled by the European Gemological Laboratory shows that combining these datasets reduces false positives for treated stones by approximately 40 percent compared with fluorescence alone.
Regional Variations and Database Development
Opals from different geographic sources carry fluorescence signatures tied to local geology, and researchers have compiled growing atlases that catalog these differences. Australian material often displays green-dominant emissions linked to organic residues, whereas Ethiopian specimens frequently show stronger orange responses associated with higher iron content. A joint study released by the University of New South Wales and the Geological Survey of Ethiopia in early 2026 integrated fluorescence data with trace-element analysis to create open-access reference sets for trade verification.
These databases help customs officials and auction houses screen incoming shipments without damaging specimens. Industry organizations such as the International Colored Gemstone Association have endorsed fluorescence mapping as a non-destructive complement to traditional refractive-index testing, and adoption rates have risen steadily since the protocols were formalized.
Integration with Other Analytical Methods
Fluorescence rarely stands alone in authenticity workflows, and analysts routinely pair it with Raman spectroscopy or X-ray diffraction when markers appear ambiguous. The combined approach distinguishes natural opaline structures from polymer-impregnated imitations that may mimic surface fluorescence yet fail deeper structural checks. Recent case examples from South African testing facilities illustrate how fluorescence anomalies prompted further examination that ultimately confirmed undisclosed treatment histories.
Software tools now overlay fluorescence images with three-dimensional models, allowing examiners to rotate specimens virtually and inspect internal zones that remain inaccessible under standard microscopy. This capability proves especially useful for larger specimens destined for high-value jewelry where provenance documentation carries significant weight.
Conclusion
Fluorescence analysis has become a standard component of opal authentication protocols worldwide, supported by expanding reference libraries and refined instrumentation. Continued collaboration among research institutions in Australia, Europe, and North America ensures that hidden markers remain detectable even as new treatment methods emerge, and the technique continues to deliver objective data that supports transparent trade practices.